Debugging applications with dd<el>
Debugging is an essential part of application development. This guide provides techniques and best practices for debugging applications built with dd<el>, with a focus on signals.
# Debugging signals
Signals are reactive primitives that update the UI when their values change. When debugging signals, you need to track their values, understand their dependencies, and identify why updates are or aren’t happening.
Inspecting signal values
The simplest way to debug a signal is to log its current value by calling the get or valueOf method:
const signal = S(0);
console.log('Current value:', signal.valueOf());
signal.get is OK, but in some situations may lead to unexpected results:
const signal = S(0);
const derived = S(()=> {
	console.log('Current value:', signal.get());
	// ↑ in rare cases this will register unwanted dependency
	// but typically this is fine ↓
	return signal.get() + 1;
});
You can also monitor signal changes by adding a listener:
// Log every time the signal changes
S.on(signal, value => console.log('Signal changed:', value));
Debugging derived signals
With derived signals (created with S(() => computation))), debugging is a bit more complex because the value depends on other signals. To understand why a derived signal isn’t updating correctly:
- Check that all dependency signals are updating correctly
- Add logging/debugger inside the computation function to see when it runs
- Verify that the computation function actually accesses the signal values with .get()
// Debugging a (derived) signal with `console.log`
import { S } from "./esm-with-signals.js";
const name= S("Alice");
const greeting = S(() => {
	// log derived signals
	const log = "Hello, " + name.get();
	console.log(log);
	console.log(name.valueOf());
	return log;
});

// log signals in general
S.on(greeting, value => console.log("Greeting changed to:", value));

name.set("Bob"); // Should trigger computation and listener`)
Examining signal via DevTools
<signal>.__dde_signal - A Symbol property used to identify and store the internal state of signal objects. It contains the following information:
- listeners: A Set of functions called when the signal value changes
- actions: Custom actions that can be performed on the signal
- onclear: Functions to run when the signal is cleared
- host: Reference to the host element/scope in which the signal was created
…to determine the current value of the signal, call signal.valueOf(). Don’t hesitate to use the debugger to inspect the signal object.
Debugging with breakpoints
Effective use of breakpoints can help track signal flow:
- Set breakpoints in signal update methods to track when values change
- Use conditional breakpoints to only break when specific signals change to certain values
- Set breakpoints in your signal computation functions to see when derived signals recalculate
- Use performance profiling to identify bottlenecks in signal updates
# Common signal debugging issues
Signal updates not triggering UI changes
If signal updates aren’t reflected in the UI, check:
- That you’re using signal.set() to update the value, not modifying objects/arrays directly
- For mutable objects, ensure you’re using actions or making proper copies before updating
- That the signal is actually connected to the DOM element (check your S.el or attribute binding code)
- That you’re passing signal corecctly (without using
*.get()) and forS.elthat you passing (derived) signals not a function (useS.el(S(()=> count.get() % 2), odd=> …)).
import { S } from "deka-dom-el/signals";
// Wrong - direct mutation doesn't trigger updates
const todos1 = S([{ text: "Learn signals", completed: false }]);
todos1.get().push({ text: "Debug signals", completed: false }); // Won't trigger updates!

// Correct - using .set() with a new array
todos1.set([...todos1.get(), { text: "Debug signals", completed: false }]);

// Better - using actions
const todos2 = S([], {
	add(text) {
		this.value.push({ text, completed: false });
	}
});
S.action(todos2, "add", "Debug signals");
Memory leaks with signal listeners
Signal listeners can cause memory leaks if not properly cleaned up. Always use AbortSignal to cancel listeners when they are used ouside the dd<el> knowledge (el, assign, S.el, … auto cleanup unnecessarily signals automatically).
Performance issues with frequently updating signals
If you notice performance issues with signals that update very frequently:
- Consider debouncing or throttling signal updates
- Make sure derived signals don’t perform expensive calculations unnecessarily
- Keep signal computations focused and minimal
import { S } from "deka-dom-el/signals";

// ===== Approach 1: Traditional debouncing with utility function =====
function debounce(func, wait) {
	let timeout;
	return (...args)=> {
		clearTimeout(timeout);
		timeout= setTimeout(() => func(...args), wait);
	};
}

const inputSignal = S("");
const debouncedSet = debounce(value => inputSignal.set(value), 300);

// In your input handler
inputElement.addEventListener("input", e => debouncedSet(e.target.value));

// ===== Approach 2: Signal debouncing utility =====
/**
 * Creates a debounced signal that only updates after delay
 * @param {any} initialValue Initial signal value
 * @param {number} delay Debounce delay in ms
 */
function createDebouncedSignal(initialValue, delay = 300) {
	// Create two signals: one for immediate updates, one for debounced values
	const immediateSignal = S(initialValue);
	const debouncedSignal = S(initialValue);

	// Keep track of the timeout
	let timeout = null;

	// Set up a listener on the immediate signal
	S.on(immediateSignal, value => {
		// Clear any existing timeout
		if (timeout) clearTimeout(timeout);

		// Set a new timeout to update the debounced signal
		timeout = setTimeout(() => {
			debouncedSignal.set(value);
		}, delay);
	});

	// Return an object with both signals and a setter function
	return {
		// The raw signal that updates immediately
		raw: immediateSignal,
		// The debounced signal that only updates after delay
		debounced: debouncedSignal,
		// Setter function to update the immediate signal
		set: value => immediateSignal.set(value)
	};
}

// Usage example
const searchInput = createDebouncedSignal("", 300);

// Log immediate changes for demonstration
S.on(searchInput.raw, value => console.log("Input changed to:", value));

// Only perform expensive operations on the debounced value
S.on(searchInput.debounced, value => {
	console.log("Performing search with:", value);
	// Expensive operation would go here
});

// In your input handler
searchElement.addEventListener("input", e => searchInput.set(e.target.value));
# Browser DevTools tips for components and reactivity
When debugging in the browser, dd<el> provides several helpful DevTools-friendly features:
Finding reactive elements in the DOM
When using S.el(), dd<el> creates reactive elements in the DOM that are automatically updated when signal values change. These elements are wrapped in special comment nodes for debugging (to be true they are also used internally, so please do not edit them by hand):
// Example of reactive element marker
<!--<dde:mark type="reactive" component="<component-name>">-->
<!-- content that updates when signal changes -->
<!--</dde:mark>-->
This is particularly useful when debugging why a reactive section isn’t updating as expected. You can inspect the elements between the comment nodes to see their current state and the signal connections through `__dde_reactive` of the host element.
Identifying components in the DOM
dd<el> marks components in the DOM with special comment nodes to help you identify component boundaries. Components created with el(MyComponent) are marked with comment nodes <!--<dde:mark type="component" name="MyComponent" host="parentElement"/>--> and includes:
- type - Identifies the type of marker ("component", "reactive", …)
- name - The name of the component function
- host - Indicates whether the host is "this" (for DocumentFragments) or "parentElement"
There are edge case when the mark can be missing. For example, the (utility) components with reactive keys such as .textContent, .innerText or .innerHTML. As they change the content of the host element.
function Counter() {
	const count = S(0);
	return el("button",
		{ textContent: count, type: "button" },
		on("click", () => count.set(count.get() + 1)),
	);
}
Identifying reactive elements in the DOM
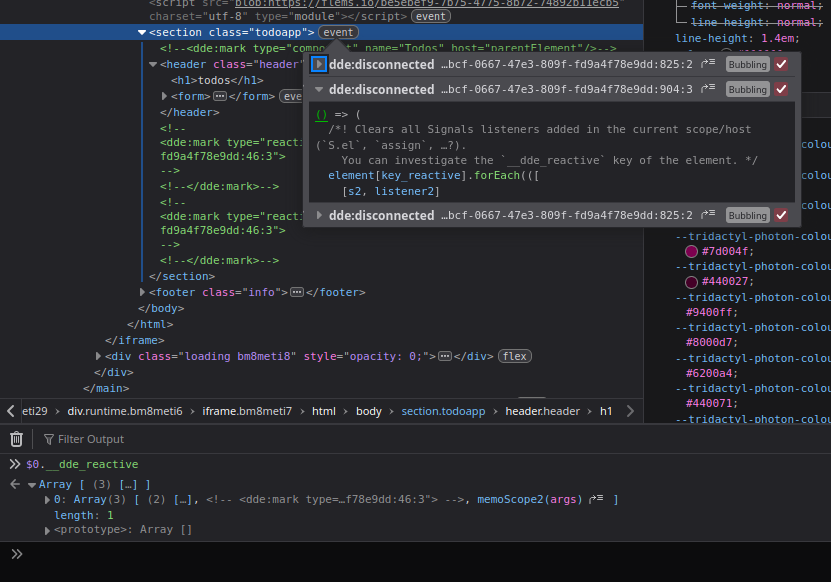
You can inspect (host) element relationships and bindings with signals in the DevTools console using $0.__dde_reactive (for currently selected element). In the console you will see a list of [ [ signal, listener ], element, property ], where:
- signal — the signal triggering the changes
- listener — the listener function (this is an internal function for dd<el>)
- element — the DOM element that is bound to the signal
- property — the attribute or property name which is changing based on the signal
…the structure of `__dde_reactive` utilizes the browser’s behavior of packing the first field, so you can see the element and property that changes in the console right away. These properties make it easier to understand the reactive structure of your application when inspecting elements.
import { el, on, scope } from "./esm-with-signals.js";
import { S } from "./esm-with-signals.js";

// Create a component with reactive elements
function ReactiveCounter() {
	const count = S(0);
		scope.host(on.connected(ev=>
				console.log(ev.target.__dde_reactive)
		));

	const counter = el('div', {
		// This element will be added into the __dde_reactive property
		textContent: count,
	});

	const incrementBtn = el('button', {
		textContent: 'Increment',
		onclick: () => count.set(count.get() + 1)
	});

	// Dynamic section will be added into __dde_signal property
	const counterInfo = S.el(count, value =>
		el('p', `Current count is ${value}`)
	);

	return el('div', { id: 'counter' }).append(
		counter,
		incrementBtn,
		counterInfo
	);
}
document.body.append(
	el(ReactiveCounter),
);

// In DevTools console:
const counter = document.querySelector('#counter');
setTimeout(()=> console.log(counter.__dde_reactive), 1000); // See reactive bindings
<element>.__dde_reactive - An array property on DOM elements that tracks signal-to-element relationships. This allows you to quickly identify which elements are reactive and what signals they’re bound to. Each entry in the array contains:
Inspecting events and listeners in DevTools
Modern browser DevTools provide built-in tools for inspecting event listeners attached to DOM elements. For example, in Firefox and Chrome, you can:
- Select an element in the Elements/Inspector panel
- Look for the "Event Listeners" tab or section
- See all event listeners attached to the element, including those added by dd<el>
Additionally, dd<el> provides special markers in the DOM that help identify debug information. Look for comments with dde:mark, dde:disconnected and __dde_reactive which indicate components, reactive regions, and other internal relationships: